Report tour
Six pages, one file. This is what each one is for, what the numbers mean, and what to do when they're bad. Every screenshot here is SpecTracer's own self-report — real numbers, not a mockup.
Live sample report
See the real thing — no setup required. Click below to open a fresh tab with SpecTracer's actual HTML output from this repo, showing all of its pages. It's exactly what you'll get after running the tool on your own project.
Open live report in a new tabThe file itself
The report is a single self-contained HTML file. All CSS and JavaScript are inlined. By
default the pages are rendered server-side into the markup; with
render_mode: "client" the report JSON is
embedded inline instead and the same pages are built from it in the browser. Either way, the only
network request is a monospace webfont from a CDN, which degrades to the system monospace if
you're offline.
- Email it, archive it, attach it to a build. No server, no build step, no dependency on the repo it came from.
- Client-side hash routing (
#/,#/pyramid, …) means you can deep-link to a page and the browser back button works. - Light and dark themes, following your system preference and toggleable in the
top-right; the choice persists in
localStorage. - Only Feature Breakdown is shown by default. Overview, Test Pyramid, Modules,
Failure Breakdown and Unlinked Tests are opt-in: set the matching key under
ui.tabs(dashboard,pyramid,modules,failures,unlinked) totrue. The first enabled of Overview / Test Pyramid becomes the landing page; otherwise Feature Breakdown is. - Run metadata strip. Key/value pairs from the config's
metadataand repeated--meta KEY=VALUEarguments (build number, run time, branch, …) appear in a separate strip above the pages, on every tab. The strip is omitted when no metadata is supplied.
1 · Overview
The page that answers "how are we doing" in about three seconds.
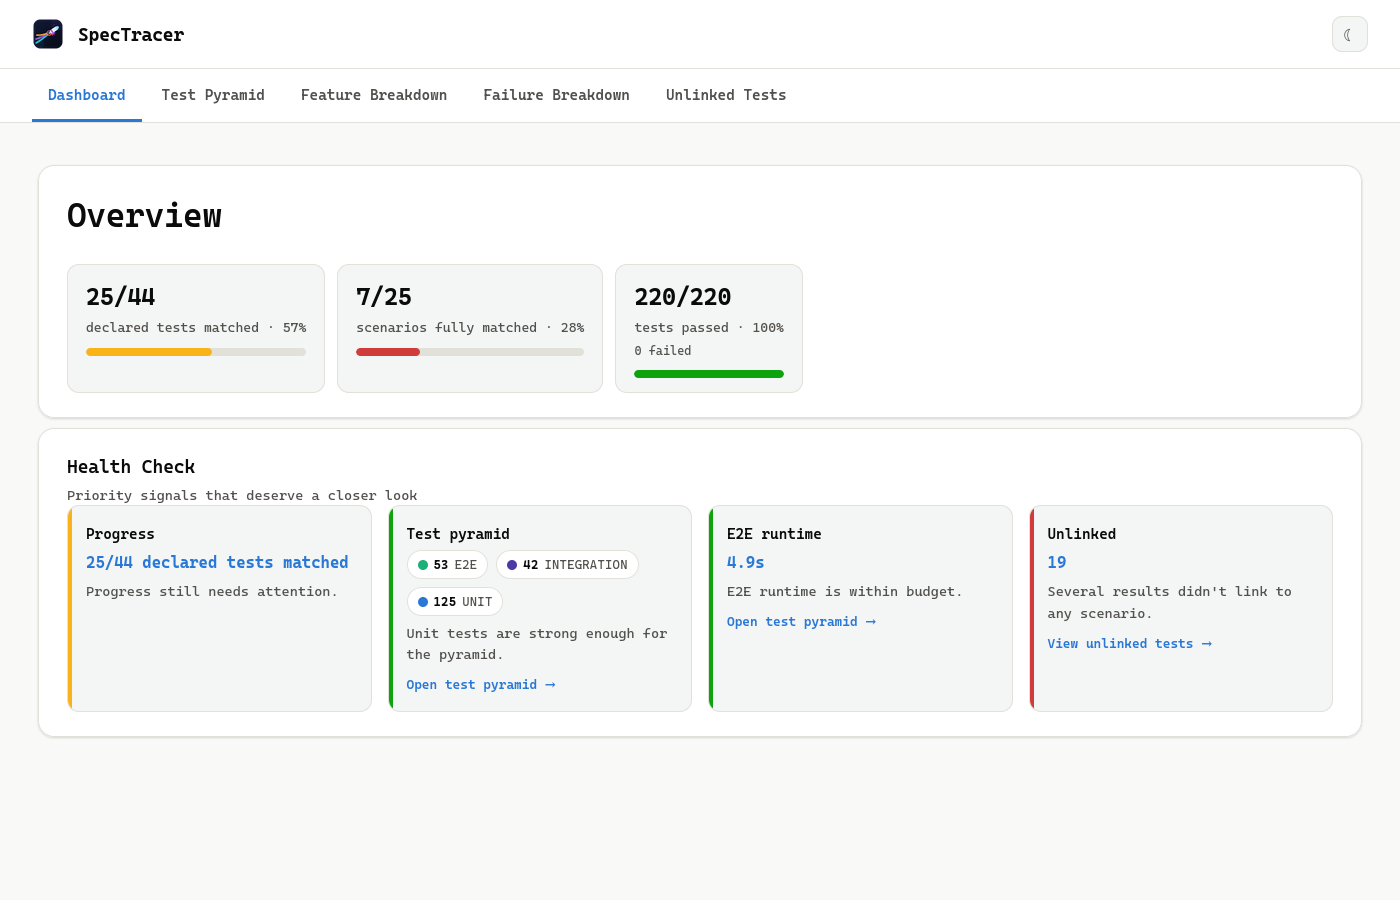
The three headline tiles
| Tile | Numerator / denominator | Read it as |
|---|---|---|
| Declared tests matched | Satisfied @require-* layer/module pairs, over all declared pairs. |
"How much of the coverage we said we needed do we actually have?" This is the headline metric and the one fail_on: ["progress"] gates on. |
| Scenarios fully matched | Scenarios with every declared layer satisfied, over all scenarios. | Strictly harder. A scenario needing three layers and having two contributes 2/3 to the first tile but 0 to this one. |
| Tests passed | Passing results over all collected results. | Plain suite health. Counts every result, linked or not. |
The five health cards
Each card is green, amber, or red, and links through to the page that explains it. Thresholds
come from health_checks in your config — see
Health checks.
Progress green
Declared-tests-matched percentage against your green/amber thresholds. Amber means "below target but not alarming"; red means below the amber floor.
Test pyramid green
Green while unit tests outnumber integration + E2E combined. Amber at exact parity, red when inverted.
E2E runtime green
Total E2E wall time against your time budget. This is the check that catches a suite getting slowly, invisibly slower.
Unlinked red
Orphaned results. Green at zero, amber at 1–3, red at 4 or more. Visual only — this one cannot gate CI.
Unconfigured modules red
Count of declared @require-*:module requirements whose module isn't a
registered config key for that layer at all. Binary — green at zero, red otherwise, no amber
band. This flags a likely config typo, distinct from a genuine coverage gap; see
Expanding a scenario below and
Troubleshooting.
2 · Test Pyramid
Test count, duration, and pass rate for each layer, drawn as proportional bars.
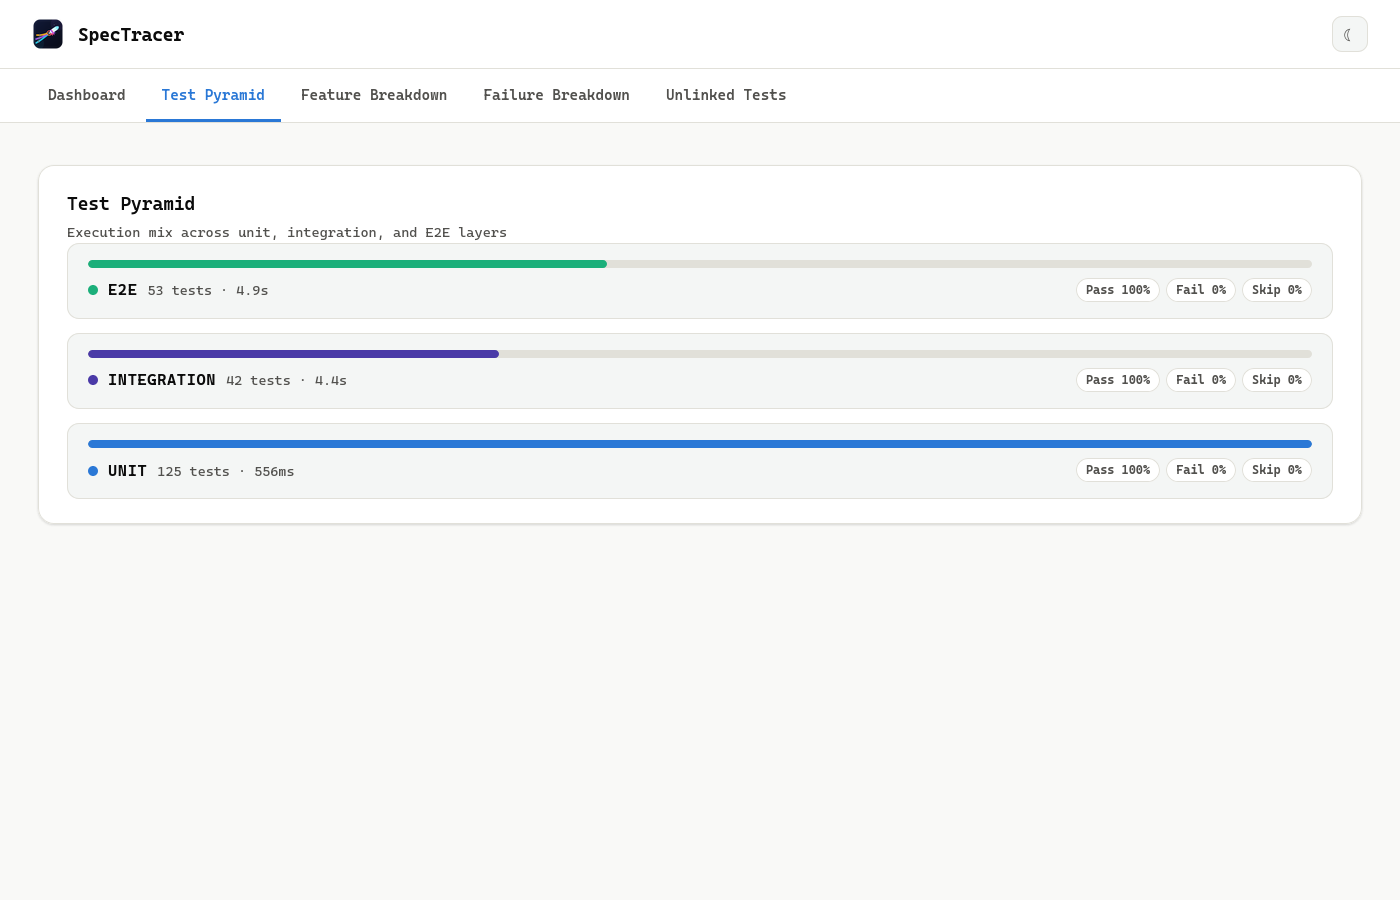
The shape is the point. A healthy pyramid has a long unit bar and short integration and E2E bars. What to look for:
- Bar length — relative test counts. If the E2E bar approaches the unit bar, the pyramid is inverting and CI is about to get slow.
- Duration — in the screenshot, 198 unit tests take 1.0s while 56 E2E tests take 5.0s. That per-test cost difference is exactly why the shape matters.
- Pass / fail / skip pills — a layer with a high skip rate is quietly not testing anything, and no coverage metric will tell you that.
unit, integration, and
e2e in the config. If your "unit" tests spin up a database, SpecTracer will happily
report a beautiful pyramid — it can only classify what you tell it.
3 · Feature Breakdown
The traceability matrix, and where you'll spend most of your time. A searchable tree: feature → scenario → individual test result.
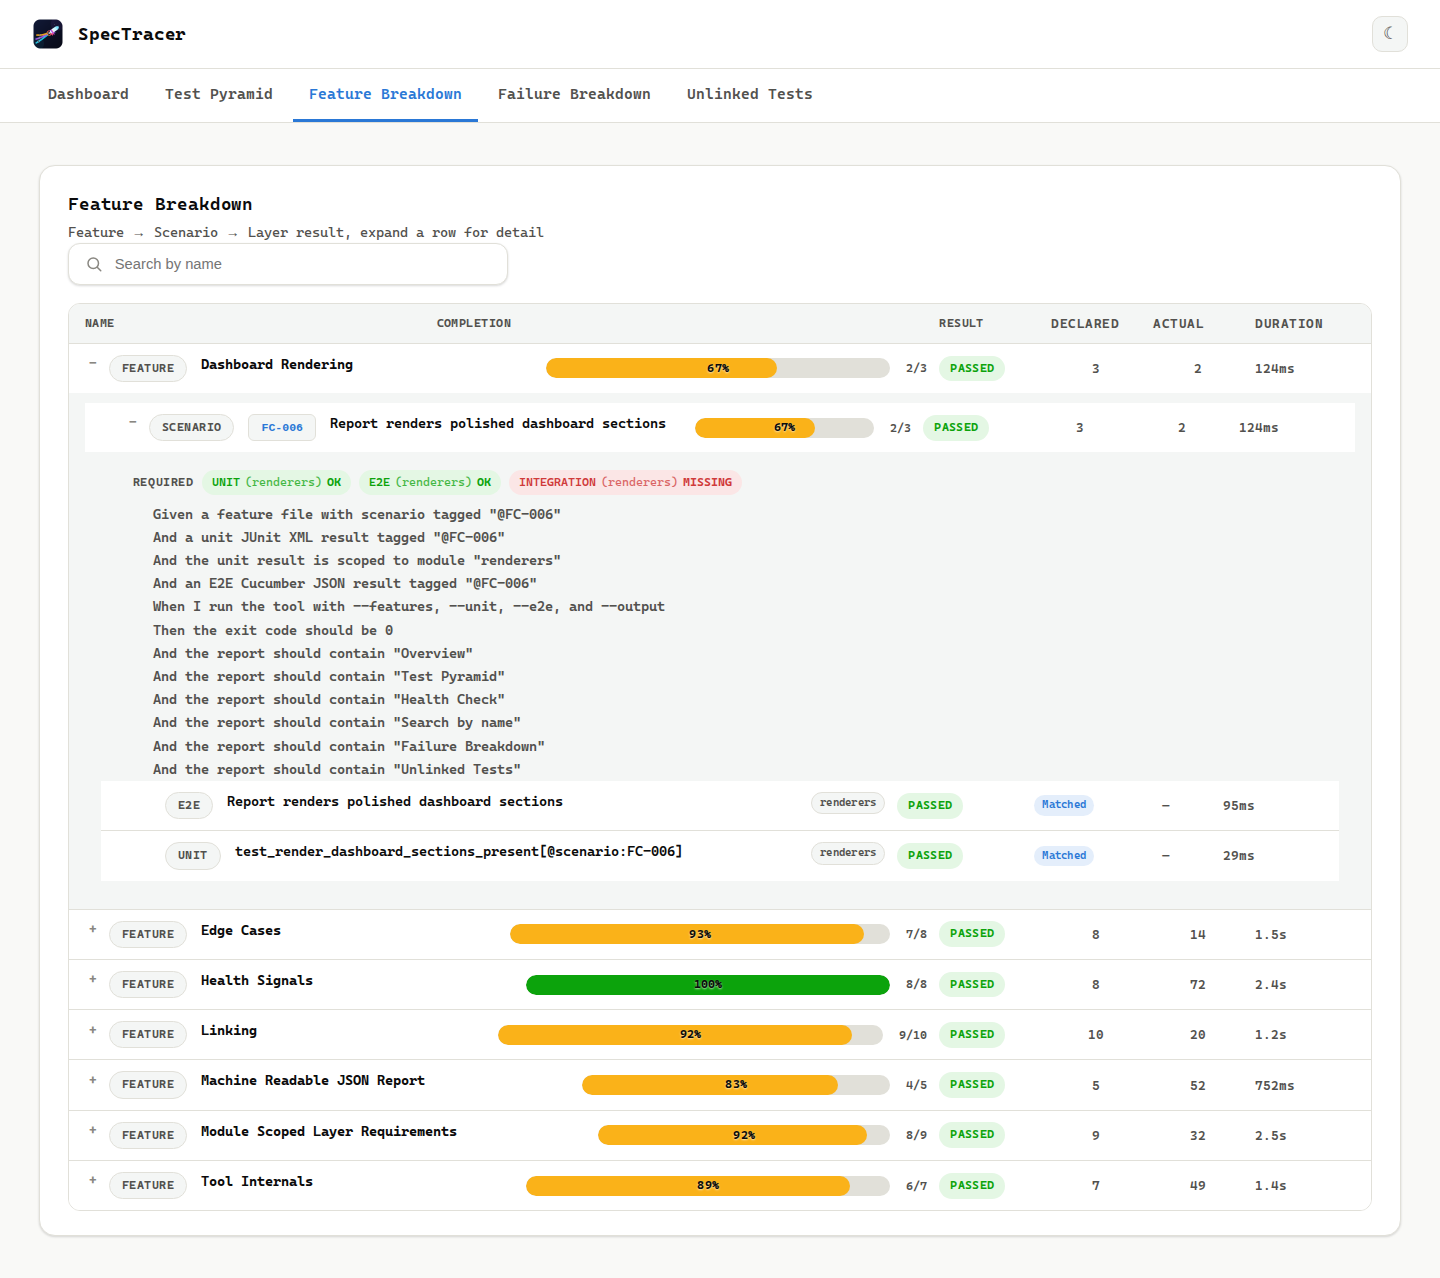
INTEGRATION (linker) MISSING chip showing exactly what's left to write.Row by row
| Column | What it shows |
|---|---|
| Name | Feature or scenario name. Scenario rows also carry the scenario id pill (e.g. FC-002) and, on result rows, the discovery module. |
| Completion | A bar and a satisfied/declared fraction — green at 100%, amber below. |
| Result | Rolled-up pass/fail/skip status. |
| Declared | How many @require-* pairs this row declares. |
| Actual | How many test results actually linked. This can exceed Declared — three unit tests can link to a scenario that declares one unit requirement. |
| Duration | Summed wall time of the linked results. |
Expanding a scenario
Expanding a scenario row reveals three things:
- Required-layer chips — one per declared requirement, showing the layer, the
module in parentheses, and one of three states:
OK,MISSING, orUNCONFIGURED. This is the single most actionable thing in the report:INTEGRATION (linker) MISSINGtells you precisely what to go write.UNCONFIGURED(shown orange, distinct from redMISSING) means the requirement names a module that isn't even a registered config key for that layer — almost always a typo, not a coverage gap:
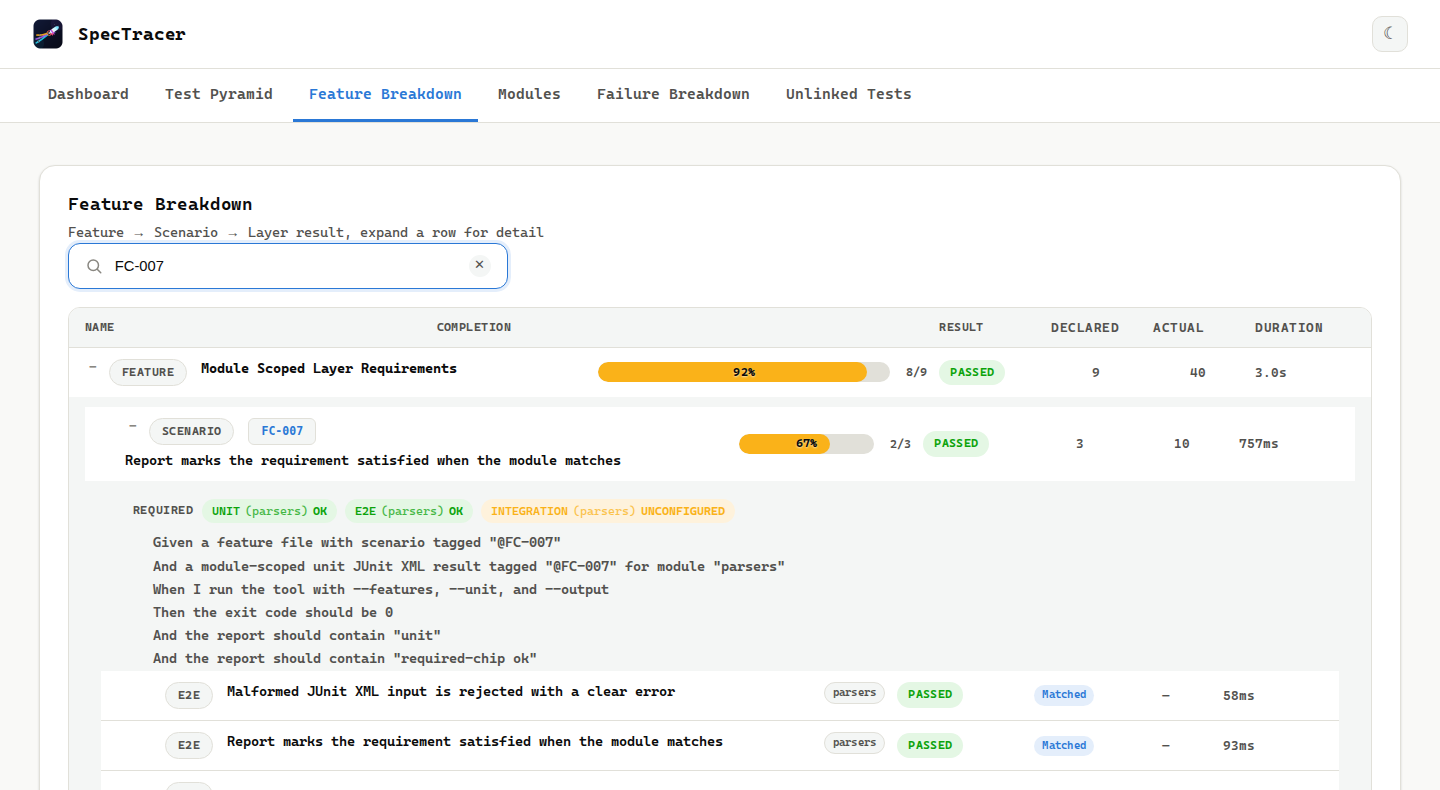
UNCONFIGURED chip — the integration config has no parsers key at all, so this can't be a genuine coverage gap.- The scenario's tags, verbatim — every
@tagfrom the feature file (including@require-*tags), shown below the required-layer chips exactly as they appear on the line aboveScenario:in the source file. - The full Gherkin text — the Given/When/Then as written, with keywords and quoted strings syntax-highlighted, so a reader who isn't in the code can still judge whether the scenario is worth the coverage it's demanding.
- The linked results — every test that claimed this scenario, with its layer, module, status, and duration.
Search filters the tree by name. Failure stack traces are deliberately not here — they live on the Failure Breakdown page so this view stays scannable.
3½ · Modules client mode
When your config registers two or more unit/integration modules, a Modules page appears next to Feature Breakdown. It splits the same tree one level down: one card per module, showing that module's completion, a unit/integration-only pyramid, and its unlinked count; the worst status (passed / skipped / failed) is shown as a colour stamp on the card.
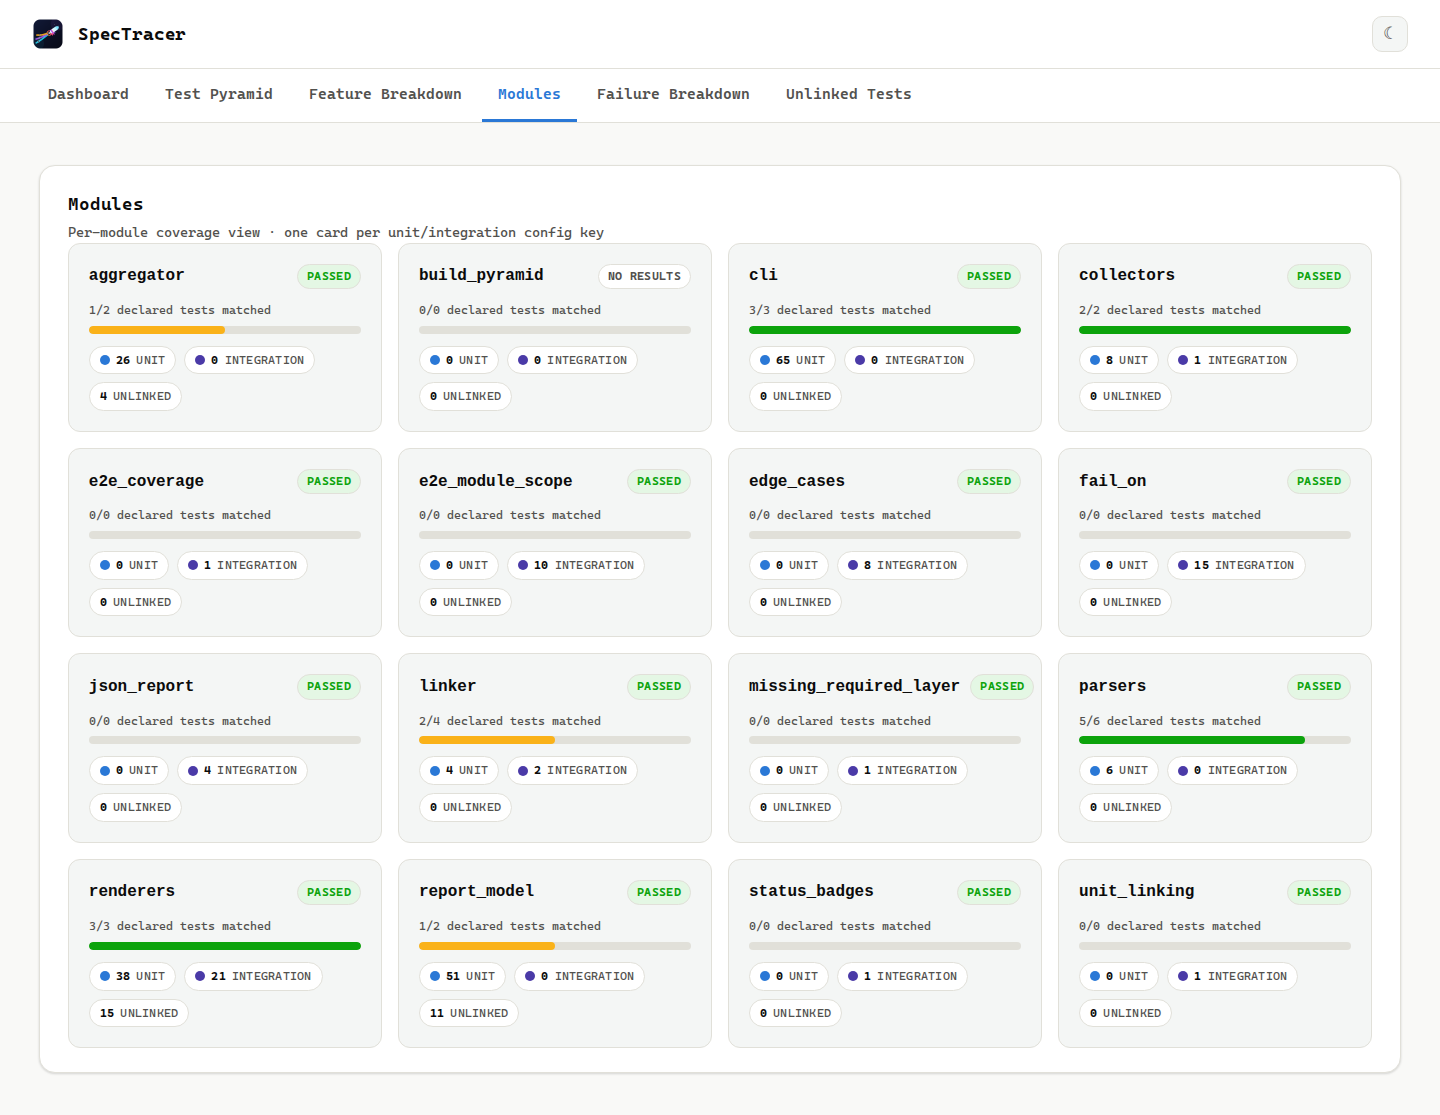
Clicking a card deep-links to #/modules/<key> and shows the Feature Breakdown tree
scoped to that module: only the selected module's @require-unit /
@require-integration chips and unit/integration results survive, so a service team can
bookmark their own slice.
unit / integration keys in the config — E2E is
fleet-level, not service-level, so it never appears on a module card. The unscoped key ""
isn't a module either. A report with fewer than two modules simply hides the page entirely.
4 · Failure Breakdown
Every failed test across all three layers, in one list, with feature and scenario context and the full stack trace on expand.
The value is not that it shows failures — your CI log does that. It's that a failure here arrives attached to the business scenario it broke, across layers that normally live in separate jobs. "Three failures, all under checkout" is a different triage conversation than three unrelated red lines in three log files.
5 · Unlinked Tests
Test results that carry tags but whose @scenario: values matched no scenario's
@id:.
This page is your typo detector. On a first run, a large unlinked count and a near-zero coverage number almost always mean the same thing: the tags on one side don't match the tags on the other. Common causes:
- A test tagged
@scenario:FC-42against a scenario tagged@id:FC42 - A scenario that was renamed and had its
@id:changed, orphaning its tests - Tests for a scenario that was deleted from the feature file
- A test tagged with the id of a scenario in a feature file the config doesn't include
Unlinked results still count toward the pyramid and the pass-rate tile — they ran, after all. They just don't count toward coverage.
The JSON twin
Set output_json and the same data is written as schema-validated JSON alongside the
HTML. It's built from the same internal model as the HTML renderer, so the two physically cannot
disagree. With render_mode: "client" the HTML embeds that exact JSON object itself, so
the machine-readable report ships inside the single HTML file even without a separate
output_json. The modules key holds the same per-module cards (completion,
unit/integration pyramid, unlinked, worst status) that the Modules page renders.
jq -r '.summary.completion.percent' reports/spectracer-report.json
jq -r '.summary.health.status'       reports/spectracer-report.json
jq -r '.summary.health.reasons[]'    reports/spectracer-report.json
Use it for PR bots, custom gates the built-in checks don't cover, or posting trends to your own dashboard. Full field reference: Configuration → JSON report.
Using it in a standup
The headline numbers are designed to be said out loud. Unlike line coverage, they mean something to people who don't read code:
- To a product owner: "We haven't tested the password reset flow at all yet" — a sentence you can read straight off the Feature Breakdown.
- To a developer: "
FC-43is missing its unit test" — the required-layer chips name the exact gap. - To a lead: "We went from 78% to 72% this sprint" — usually because scenarios were added faster than tests, which is worth knowing in week two rather than week six.
Track that trend properly by posting summary from the JSON report to whatever
metrics system you already run — see Historical trends.