Your feature files already say what needs testing. SpecTracer tells you what actually got tested.
Point it at your Gherkin .feature files and the JUnit XML and Cucumber JSON
your suites already emit. Get one self-contained HTML report showing which business
scenarios are covered at which layer — and a schema-validated JSON twin for CI.
pip install spec-tracer
No test runner. No agent. No database. One CLI, one config file, one HTML file out.
Line coverage says 87%. Nobody can tell you if checkout is tested.
Code coverage measures lines executed. It cannot answer the question your product owner actually asks. SpecTracer measures scenario coverage instead — and tracks it per layer, because "we have an E2E test" is not the same as "this is properly tested".
Fragmented visibility
Unit, integration, and E2E results live in different directories, jobs, or repos. There is no single view.
Silently inverted pyramids
Slow E2E tests accumulate in place of fast unit tests, and nobody notices until CI takes 40 minutes.
No traceability
You can't prove a given business scenario is covered at every layer it's supposed to be.
Tooling lock-in
Allure is for Java. Cypress Dashboard is for Cypress. Polyglot repos get nothing.
Three moving parts, and you already have two of them
SpecTracer never reads your source code and never runs your tests. It reads
.feature files, reads test-result files, and matches one against the other by tag.
This is the Declare → Tag → Run workflow, visualized:
Give each scenario an identity
Add @id:FC-42 to a scenario, and declare which layers must cover it with @require-unit / @require-integration / @require-e2e.
Point your tests back at it
Tag the corresponding tests @scenario:FC-42 — in the test name, the classname, a JUnit property, or a Cucumber tag. Then run your suites the way you already do, emitting JUnit XML and Cucumber JSON.
Run spec-tracer
It auto-discovers spectracer.config.json, links results to scenarios, and
writes the report. Add output_json to get the machine-readable twin, and
fail_on to make CI enforce it.
Feature: Checkout

  @id:FC-42 @require-unit @require-e2e:checkout
  Scenario: Card payment succeeds
    Given a cart with one item
    When the customer pays by card
Then the order is confirmeddef test_card_payment_succeeds():
# the tag can live in the name, classname,
# or a JUnit <property> — whichever your
# framework populates
...One HTML file you can email, archive, or attach to a build
All CSS and JS inlined — the only network request is a monospace font that degrades to a system fallback. Five sections, all searchable, all offline — six with client mode's per-module Modules page.
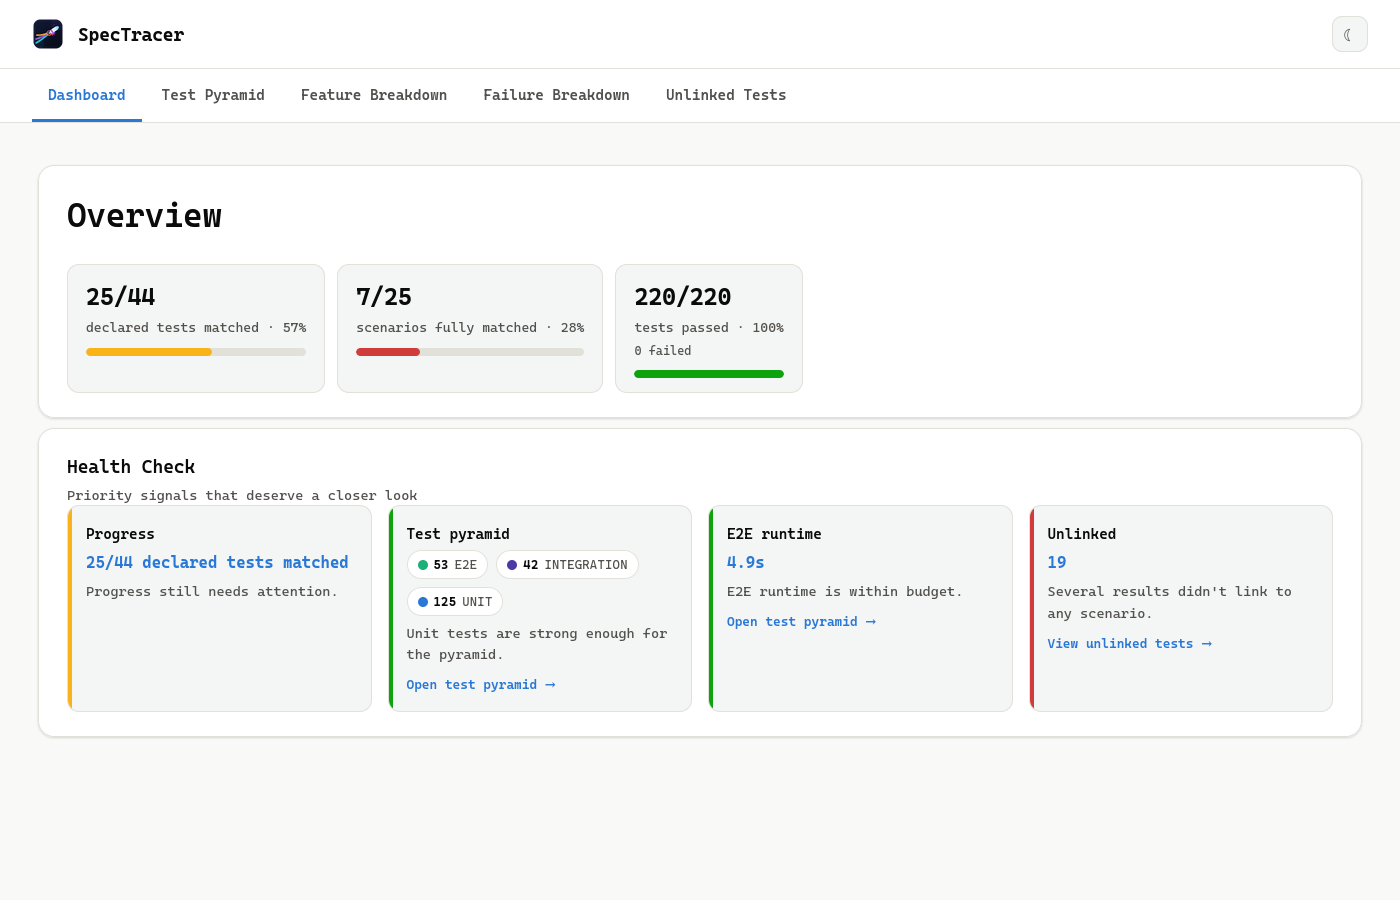
Coverage progress
Two headline numbers: declared tests matched, and scenarios fully matched. Colour-coded against thresholds you set.
Test pyramid
Test count, duration, and pass rate for each of the three layers — so an inverting pyramid is visible the day it starts.
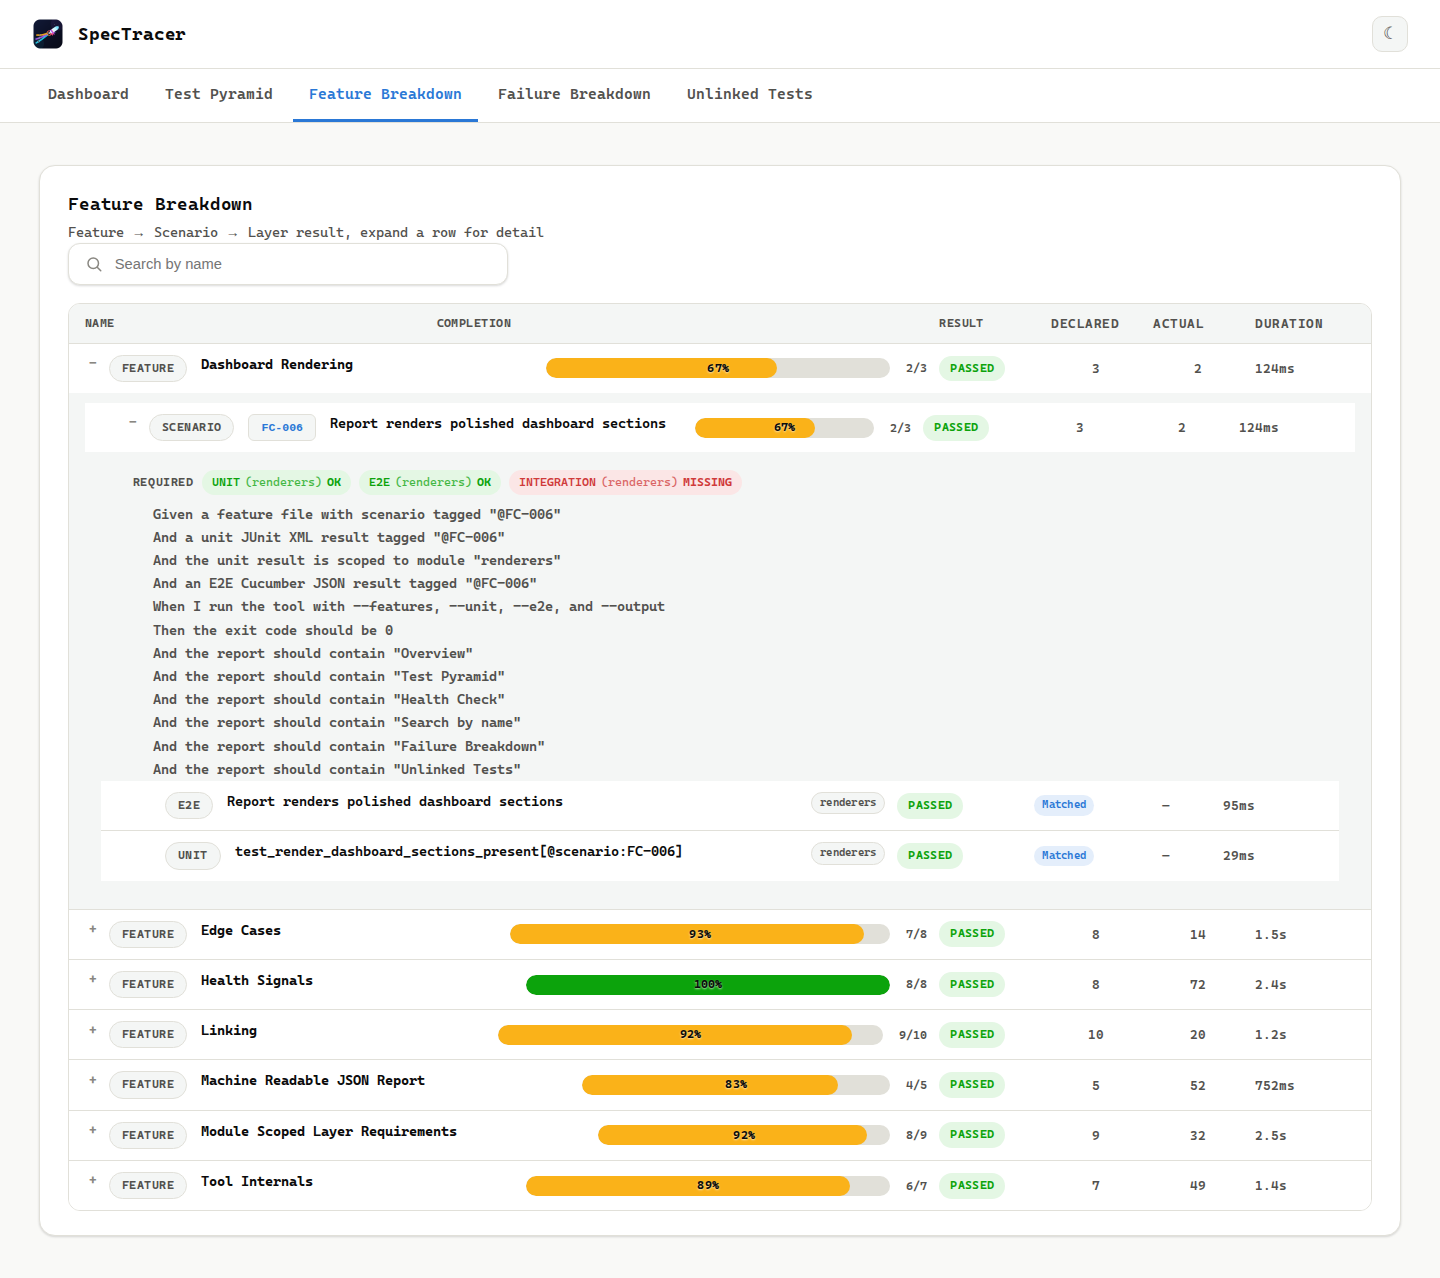
Feature breakdown
Searchable tree down to individual test results, with the full Gherkin text and ✓/✗ per required layer.
Failure breakdown
Every failure across all three layers in one place, with scenario context and the full stack trace on expand.
Unlinked tests
Results whose @scenario: tags matched nothing — the fastest way to catch a typo'd tag.
JSON twin
Set output_json and get the same data as schema-validated JSON, built from the same model so the two can't drift — or let render_mode: "client" embed it directly inside the single HTML file.
Modules client mode
With two or more configured unit/integration modules, a per-module card and a scoped
#/modules/<key> tree let a service team bookmark just their own slice.
Make it a gate, not a poster
A report nobody opens changes nothing. error_on_failure fails the build on test
failures; fail_on fails it when a health check goes red — an inverted pyramid, an
E2E suite past its time budget, coverage below your floor.
- Exits
1on config errors, parse errors, and any gate you've enabled - Amber never gates — only red does, so warnings stay warnings
- Works the same in GitHub Actions, GitLab CI, Jenkins, or a shell script
- Post
summaryfrom the JSON to your own dashboard for trends over time
{
  "features": ["./features"],
  "unit":        { "": ["./reports/unit.xml"] },
  "integration": { "": ["./reports/int.xml"] },
  "e2e":         { "": ["./reports/e2e.json"] },
  "output":      "./reports/spectracer-report.html",
  "output_json": "./reports/spectracer-report.json",

  // fail the build when these go red
  "fail_on": ["pyramid", "e2e_runtime"]
}If it emits JUnit XML or Cucumber JSON, it works
SpecTracer never parses your source. It has no opinion about your language, framework, or runner — only about the two file formats nearly all of them already produce.
JUnit XML → unit & integration
Tags are read from the name attribute, the classname attribute, or
<property> elements — whichever your framework fills in.
Cucumber JSON → E2E
Tags come from the native scenario-level tags array. Both a single feature object and an array of them are accepted.
Gherkin → scope
Standard .feature files define what should be tested. They're the denominator the whole report is built on.
The screenshots on this site are SpecTracer's own numbers
Every feature starts as a .feature file and is validated by a behave E2E scenario
before it's implemented. CI runs pytest for unit and integration, behave for E2E, then feeds
all three back into SpecTracer to produce a self-report.
The emitted JSON is validated against the shipped schema by both the integration suite and the behave suite — the contract is enforced by tests, not just documented.
Ten minutes to your first report
Install, tag one scenario, point the config at the test output you already produce. You'll know immediately how much of your spec is actually covered.